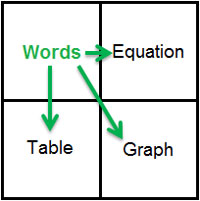
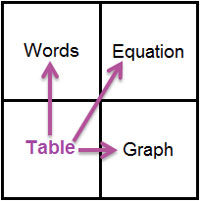
When creating a graph from a verbal description, it is usually best to make a table of values first. Because of this, we will cover the specific concepts of graphing data in more depth in section 3. In this section, we will concentrate on the general properties of the graph of the data.
- If Marta's family pays the security deposit, and then due to a change in plans ends up staying 0 nights, how much will they have paid in total?
- Is the cost increasing or decreasing as the number of days increases?
- If you were to graph this data, would you expect the graph to rise or fall as you move to higher x values? Why?
- In general, how would you describe the graph of the data associated with this problem?

Darius earned a total of $800 mowing lawns over the summer. He wants to buy video games that cost $25.00 each. How can you determine y, the amount of money he will have left if he buys x video games?
5. Write a plan that you could use to solve this problem.
6. Copy the following table into your notes and use your solution plan to fill in the missing information.
Number of games
(x) |
Process |
Remaining money
(y) |
| 2 |
800 – 25(2) |
$750.00 |
| 3 |
|
|
| 4 |
|
|
| 5 |
|
|
| |
|
|
| x |
|
|
7. Write your plan as an equation.
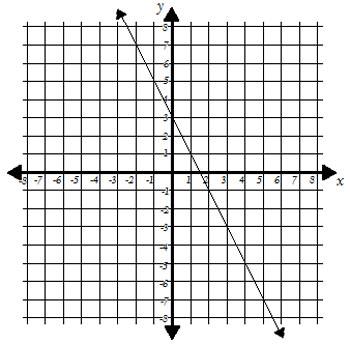
8. What would you expect the graph of this data to look like? Why?